Autores
Conceição, V.S. (INSTITUTE OF CHEMISTRY, UNIVERSITY OF SÃO PAULO) ; Bertotti, M. (INSTITUTE OF CHEMISTRY, UNIVERSITY OF SÃO PAULO)
Resumo
Quantitative analytical methods free of reagents, washing, or calibration steps
contributing to the minimization of waste generation are very attractive.
Accordingly, this work proposes a proof-of-concept study toward quantitative
determinations with a microelectrode through only one single chronoamperogram. A
thickener was added to potassium ferricyanide solutions to change the viscosity
and mimic a complex sample medium. The concentration values calculated using the
proposed calibration-free method were in satisfactory agreement with the
theoretical value (maximum deviation of 9.8%). Hence this seems to be a simple and
promising method to obtain reliable and quantitative information without
calibration protocols.
Palavras chaves
calibration-free; microelectrodes; electrochemical
Introdução
Analytical methods are fundamental for getting quantitative information regarding
chemical species in environmental compartments and foods (SKOOG et al., 2006).
Quantitative analyzes usually require calibration curves, resulting in excessive
use of reagents, waste generation, and long time. In more complex matrices, using
calibration plots may lead to more significant analytical errors. A possibility to
circumvent such a problem relies on direct methods, such as coulometry and
gravimetry. However, these methods are sensitive to the presence of contaminants
and require long analysis times to ensure that the target analyte undergoes the
reaction of interest. The interferent removal to isolate the analyte can be
accomplished by using separation, extraction, and purification methods, which are
slow and require the use of organic solvents that are harmful to the environment
and to life (MOTSHAKERI et al., 2019). Taking these aspects into account, we show
in this work our efforts in the attempt to develop an easy quantitative
electrochemical method that does not depend on extended analysis time and is
calibration-free.
Material e métodos
Microelectrode manufacturing: The microelectrodes were homemade by
attaching a commercial carbon microfiber (r = 5 μm) to a nickel-chromium wire
using silver glue. The microfiber was inserted into a 100 μL micropipette
plastic tip. To ensure electrical contact between the nickel-chromium wire and
the microfiber and to avoid any damage, carbon black was also added inside the
micropipette. The micropipette was then completely filled with Araldite epoxy
glue, and the system was sealed with parafilm. Preparation of solutions:
Potassium ferricyanide (K3[Fe(CN)6]) solutions of well-
known concentrations were carefully prepared in 1.0 M KCl medium. Ethylene
glycol thickener was added to the solutions (10% (v/v)) to simulate a different
chemical environment, as the response in electrochemical measurements (current)
depends on the viscosity. The solutions were prepared from analytical grade
reagents dissolved in deionized water (processed in a Nanopure Infinity system,
Barnstead). Potassium chloride and potassium ferricyanide were purchased from
Sigma-Aldrich® and ethylene glycol from Vetec®. Electrochemical Measurements:
All experiments were performed using an AUTOLAB PGSTAT128N potentiostat
(Metrohm Brazil). The electrochemical experiments were carried out in a typical
cell with three electrodes: work, reference, and platinum wire counter
electrode. All potentials are reported against a Ag/AgCl (saturated KCl)
reference electrode prepared by electrodeposition of AgCl on a silver wire,
which was then placed in a micropipette tip containing a KCl saturated solution.
Resultado e discussão
Microelectrode radius: Figure 1 shows the optical microscopy image of a
carbon fiber disk microelectrode. The microelectrode radius value was found to
be 5.27 μm. Development of the calibration-free method: The proposed
calibration-free method relies on the measurement of the steady-state current
(IL) at a disc microelectrode, as follows: IL = 4nFDCr
(Equation 1) where F is the Faraday constant, D is the diffusion coefficient, n
is the number of electrons involved in the electron-transfer step, C is the bulk
concentration of the electroactive species, and r is the radius of the
microelectrode. The radius value can be precisely determined by optical
microscopy or electrochemical methods – instead of using the value provided by
the manufacturer - and the n value can be obtained through knowledge of the
electrochemical reaction. Information on the diffusion coefficient is difficult
to obtain since D depends on the sample medium. However, such value can be
extracted from the chronoamperogram based on a methodology proposed by Denuault
and coauthors (1991). The linearization of the transient region in the
chronoamperogram (current (i/t) normalized by the steady-state
current (IL) as a function of t-½) (Figure 2) allows
calculating the diffusion coefficient (D) according to the expression: D =
πr2/16S2 (Equation 2) where S is the slope of the straight
line (inset of Figure 2). Taking into account the calculated diffusion
coefficient and by using Equation 1, the concentration of the target analyte can
be easily determined. In short, all parameters necessary to calculate the
analyte concentration are taken from only one chronoamperometric experiment,
without the need for a calibration curve since IL and D are obtained
by chronoamperometry, r is a geometric value, F is a constant, and the number of
electrons (n) is defined based on the redox process involving the species of
interest. Concentration: From the information obtained by
chronoamperometry, the concentration of the electroactive species was
determined, as shown in Table 1 (n = 5 independent experiments). The
concentration values found are within an acceptable error, less than 10%. The
calibration-free methodology allows calculating the diffusion coefficient using
Equation 2. For the experimental conditions of this experiment (1 M KCl; 10%
ethylene glycol), the diffusion coefficient found for ferricyanide was (5.3±0.2)
x 10-6 cm2 s-1. Such a value is lower than the
one in pure aqueous solution (6.32 x 10⁻⁶ cm2
s-1 in 1 M KCl) (ADAMS, 1969), which is expected considering the
increase in the viscosity.
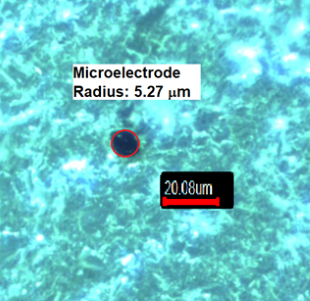
Figure 1 - Optical microscopy image of a carbon microelectrode (400x)
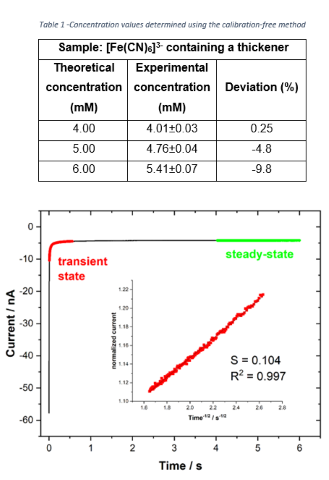
Figure 2 -Chronoamperometry in 4.0 mM ferricyanide (in 1.0 M KCl) with 10% (v/v) of thickener. E = -0.1 V.Inset: Linearization of the transient region
Conclusões
The proof-of-concept experiments yielded satisfactory results in good agreement
with the expected values. Therefore, the presented method has great potential to
be applied in the quantitative determination of electroactive chemical species. In
addition to optimizing the process, since the chronoamperometry analysis is
performed in less than 1 min, the proposed methodology contributes to Green
Chemistry by minimizing the reagents and waste disposal from solutions used to
perform calibration plots.
Agradecimentos
The authors would like to thank the São Paulo State Research Foundation (FAPESP
2018/08782-1), the National Council for Scientific and Technological Development
(CNPq) and CAPES (CODE - 0561/2021) for the generous funding.
Referências
ADAMS, R.N. Electrochemistry at Solid Electrodes. Marcel Dekker. New York, 1969.
SKOOG, D.A.; WEST, D.M.; HOLLER, J.; CROUCH, S.R. Fundamentos de Química Analítica. Tradução da 8ª edição norte-americana. Editora Thomson, p. 2, 2006.
Denuault, G; Mirkin, M.V., Bard, A.J. Direct Determination of Diffusion Coefficients by Chronoamperometry at Microdisk Electrodes. Journal of Electroanalytical Chemistry and Interfacial Electrochemistry, 308, p. 1-2, 1991.
MOTSHAKERI, M.; PHILLIPS, A. R.J.; KILMARTIN, P. A. Application of Cyclic Voltammetry to Analyse Uric Acid and Reducing Agents in Commercial Milks. Food Chemistry, v. 293, p. 23-31, 2019.